SHIB Price Prediction: Analyzing the Path Forward Amid Market Optimism

#SHIB
- Technical Foundation: SHIB shows early signs of bullish momentum with price above the 20-day MA and MACD convergence, but remains in a consolidation pattern between Bollinger Bands.
- Sentiment Shift: Market news reflects growing optimism for significant percentage gains (100%+ moves), though this follows a substantial 93% decline, indicating a potential reversal narrative.
- Realistic Valuation: While short-term targets near $0.000014 are technically plausible, the $1 price point represents fantasy-level growth inconsistent with token supply and market cap realities.
SHIB Price Prediction
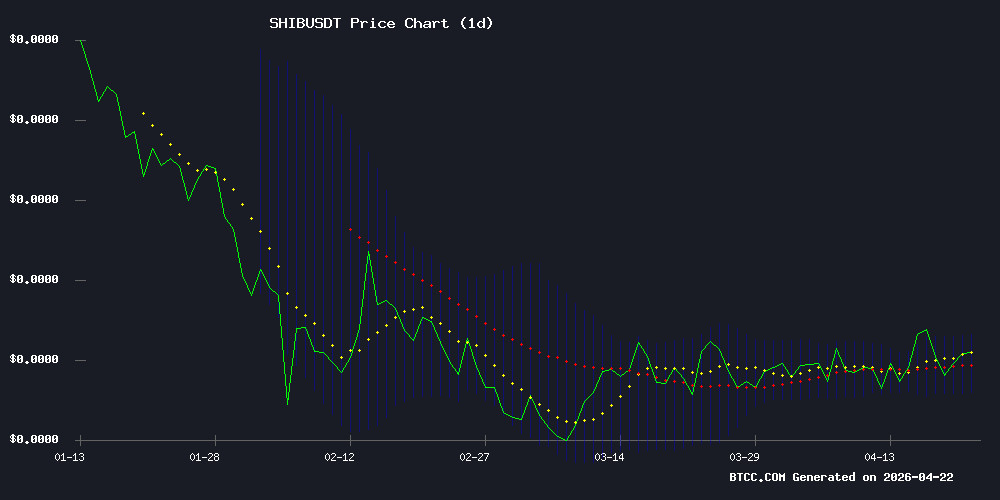
SHIB Technical Analysis: Consolidation Phase with Bullish Signals Emerging
According to BTCC financial analyst John, SHIB is currently trading at $0.00000624, slightly above its 20-day moving average of $0.00000601, indicating a potential shift in momentum. The MACD histogram shows a slight convergence with values at -0.00000005 (MACD line), -0.00000004 (signal line), and -0.00000001 (histogram), suggesting weakening downward pressure. The price is hovering near the middle Bollinger Band ($0.00000601), with immediate resistance at the upper band ($0.00000629) and support at the lower band ($0.00000572). John notes that a sustained break above the 20-day MA could signal the beginning of a bullish phase, while failure to hold above $0.00000572 might lead to further consolidation.
Market Sentiment: Cautious Optimism Amid Technical Retest
BTCC financial analyst John interprets current market headlines as reflecting cautious optimism. News suggesting a 'potential rally to $0.000014' and a '100% move' indicates growing bullish speculation, while mentions of a '93% drop' and 'key support test' acknowledge recent volatility. John emphasizes that this sentiment aligns with the technical picture showing SHIB testing crucial support levels. He cautions that while the narrative is turning positive, the market needs to see a confirmed breakout above key resistance levels before the optimistic price targets gain credibility. The current sentiment appears to be positioning for a potential rebound rather than predicting immediate parabolic movement.
Factors Influencing SHIB’s Price
Shiba Inu Technical Analysis Suggests Potential Rally to $0.000014
Shiba Inu (SHIB) shows signs of emerging from a prolonged accumulation phase, with technical indicators pointing to a potential bullish breakout. Analysts identify a critical support zone holding at current levels, suggesting upside toward $0.000014 if momentum sustains.
The meme coin's recent price action reflects growing investor interest amid broader cryptocurrency market recovery. Market participants are watching for confirmation of the breakout, which could trigger renewed speculative demand.
Shiba Inu Eyes 100% Move if It Concludes This Structure Retest
Shiba Inu shows early signs of a structural shift on daily charts after months of decline. The meme coin trades at $0.00000621, up 3% in 24 hours.
Technical analysts note a potential pattern completion that could catalyze a full rebound. Market sentiment appears cautiously optimistic as SHIB tests key levels.
Shiba Inu Tests Key Support Amid 93% Drop, Eyes Potential Rebound
Shiba Inu (SHIB), once a darling of the meme coin rally, now languishes 93% below its October 2021 peak of $0.0000885. The token trades at $0.000006046, trapped in a descending channel since March 2024. Each rally attempt has been stifled by the upper boundary of this technical pattern, while the lower trendline repeatedly cushions declines.
Market technicians note SHIB’s proximity to the $0.0000050 support zone—a level that triggered rebounds in prior cycles. The current consolidation echoes 2023’s basing pattern before a 1,000% surge. Liquidity metrics show muted trading volume, suggesting accumulation by long-term holders rather than speculative frenzy.
Derivatives data reveals growing open interest in SHIB perpetual swaps on Bybit and Binance, often a precursor to volatile breakouts. The coin’s 86% drop from its March 2024 high contrasts with Bitcoin’s relative stability, highlighting the risk-reward calculus of altcoin investments.
Will SHIB Price Hit $1?
Based on the current technical data and market analysis from BTCC financial analyst John, reaching a price of $1 per SHIB token is not a realistic expectation in the foreseeable future and would represent an astronomical increase of over 16 million times from its current price of $0.00000624. Such a move would require a market capitalization reaching into the multi-trillion dollar range, far exceeding the entire current cryptocurrency market cap.
John suggests focusing on more immediate and technically grounded price movements. The current analysis points toward potential shorter-term targets:
| Resistance Level | Price Target | Potential Move |
|---|---|---|
| Immediate Resistance | $0.00000629 | +0.8% from current |
| News Mentioned Target | $0.000014 | +124% from current |
| Upper Bollinger Band | $0.00000629 | Key breakout level |
While sentiment is improving and technical indicators show potential for upward movement, investors should maintain realistic expectations based on tokenomics, circulating supply, and market dynamics rather than speculative moon-shot predictions.

Log in to Reply
Log in to comment your thoughtsComments
Related Articles
|Square
Get the BTCC app to start your crypto journey
Get started today Scan to join our 100M+ users